This function generates a Triangular sampling with minimum \(a\), mode \(c\), and maximum \(b\).
u = triangular_sampling(parameters, method, n_samples, seed)
Input variables
| Name | Description | Type |
|---|---|---|
parameters | Dictionary of parameters for the triangular distribution. Keys:
| Dictionary |
method | Sampling method. Supports the following values:
| String |
n_samples | Number of samples to generate | Integer |
seed | Seed for random number generation. Use None for a random seed | Integer or None |
Output variables
| Name | Description | Type |
|---|---|---|
u | Random samples | List |
Example 1
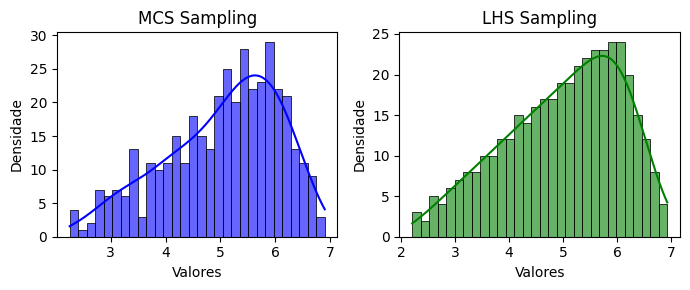
In this example, we will use the triangular_sampling function from the parepy_toolbox to generate two random samples (\(n=400\)) following a triangular distribution. The first set is sampled using the Monte Carlo Sampling (MCS) method, and the second using the Latin Hypercube Sampling (LHS) method. Minimum, mode, and maximum are defined as \([2, 6, 7]\). The results are visualized using histograms with Kernel Density Estimates (KDE) plotted (using matplotlib lib) side-by-side for comparison.
# Libraries
import matplotlib.pyplot as plt

from parepy_toolbox import triangular_sampling

# Sampling
n = 400
x = triangular_sampling({'min': 2, 'mode': 6, 'max': 7}, 'mcs', n)
y = triangular_sampling({'min': 2, 'mode': 6, 'max': 7}, 'lhs', n)

# Plot
fig, axes = plt.subplots(1, 2, figsize=(7, 3))
sns.histplot(x, kde=True, bins=30, color='blue', ax=axes[0], alpha=0.6, edgecolor='black')
axes[0].set_title('MCS Sampling')
axes[0].set_xlabel('Values')
axes[0].set_ylabel('Density')
sns.histplot(y, kde=True, bins=30, color='green', ax=axes[1], alpha=0.6, edgecolor='black')
axes[1].set_title('LHS Sampling')
axes[1].set_xlabel('Values')
axes[1].set_ylabel('Density')
plt.tight_layout()
plt.show()

Figure 1. Triangular variable example.
Example 2
In this example, we will use the triangular_sampling function from the parepy_toolbox to generate two random samples (\(n=3\)) following a triangular distribution. Using the Monte Carlo algorithm and the specific seed (seed=25), we generated 3 times and compared the results.
# Library
from parepy_toolbox import triangular_sampling

# Sampling
n = 3
x0 = triangular_sampling({'min': 2, 'mode': 6, 'max': 7}, 'mcs', n, 25)
x1 = triangular_sampling({'min': 2, 'mode': 6, 'max': 7}, 'mcs', n, 25)
x2 = triangular_sampling({'min': 2, 'mode': 6, 'max': 7}, 'mcs', n, 25)
print(x0, '\n', x1, '\n', x2)
Output details.
[3.911914212156261, 2.763962517823044, 6.5574659216434235]
[3.911914212156261, 2.763962517823044, 6.5574659216434235]
[3.911914212156261, 2.763962517823044, 6.5574659216434235]
Note that using the seed 25 by 3 times, we can generate the same values in a random variable.