contour_chart
This function creates a filled contour plot using matplotlib.
contour_chart(dataset, plot_setup)
Input Variables
| Name | Description | Type |
|---|---|---|
plot_setup | Dictionary containing the data to plot. Must include:
| Dictionary |
dataset | Array or list containing the dataset values to plot | List or Array |
Output Variables
| Name | Description | Type |
|---|---|---|
None | The function displays the contour plot on the screen and saves it to the local folder of the | None |
Example 1
Use the contour_chart function to create a filled contour plot.
# Data
X, Y = np.meshgrid(np.linspace(-5, 10, 100),
                   np.linspace(-5, 10, 100))
Z = np.sqrt(X ** 2 + Y ** 2)

setup = {
    'NAME': 'CONTOUR',
    'DPI': 600,
    'EXTENSION': 'svg',
    'TITLE': 'Color bar title',
    'LEVELS': 25
}
dataset = {
    'X': X,
    'Y': Y,
    'Z': Z
}
contour_chart(DATASET=dataset, PLOT_SETUP=setup)
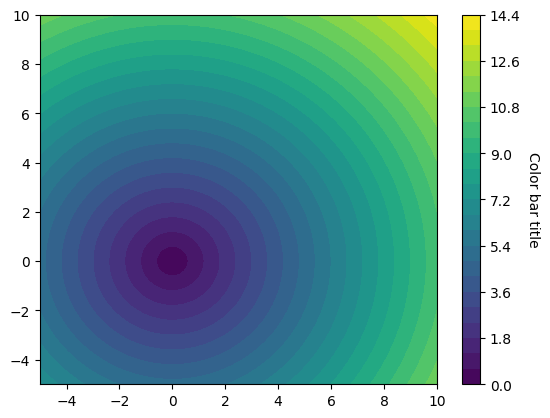
Figure 1. Filled Contour Plot.