histogram_chart
This function shows a Boxplot and Histogram in a single chart.
histogram_chart(**kwargs)
Input variables
| Name | Description | Type |
|---|---|---|
plot_setup | Settings for the chart (Dictionary with the following keys):
| Dictionary |
dataset | Dataset to plot | List or array |
Output variables
| Name | Description | Type |
|---|---|---|
None | The function displays the plot on the screen and saves it to the local folder of the .ipynb or .py | None |
Example 1
We use the histogram_chart function to plot a series of random numbers with normal distribution.
# pip install easyplot-toolbox
# or
# pip install --upgrade easyplot-toolbox
from easyplot_toolbox import *
# or
# from easyplot_toolbox import histogram_chart

# Data
df = np.random.normal(0, 1, 1000)

# Chart config
chart_config = {
              'name': "histogram_chart",
              'width': 16,
              'height': 8,
              'extension': 'png',
              'dots_per_inch': 600,
              'x_axis_label': '$x_{i}$ variable',
              'x_axis_size': 25,
              'y_axis_label': 'Frequency',
              'y_axis_size': 12,
              'axises_color': 'red',
              'labels_size': 15,
              'labels_color': '#0E6251',
              'chart_color': '#581845',
              'bins': 20,
             }

# Call function
histogram_chart(dataset=df, plot_setup=chart_config)
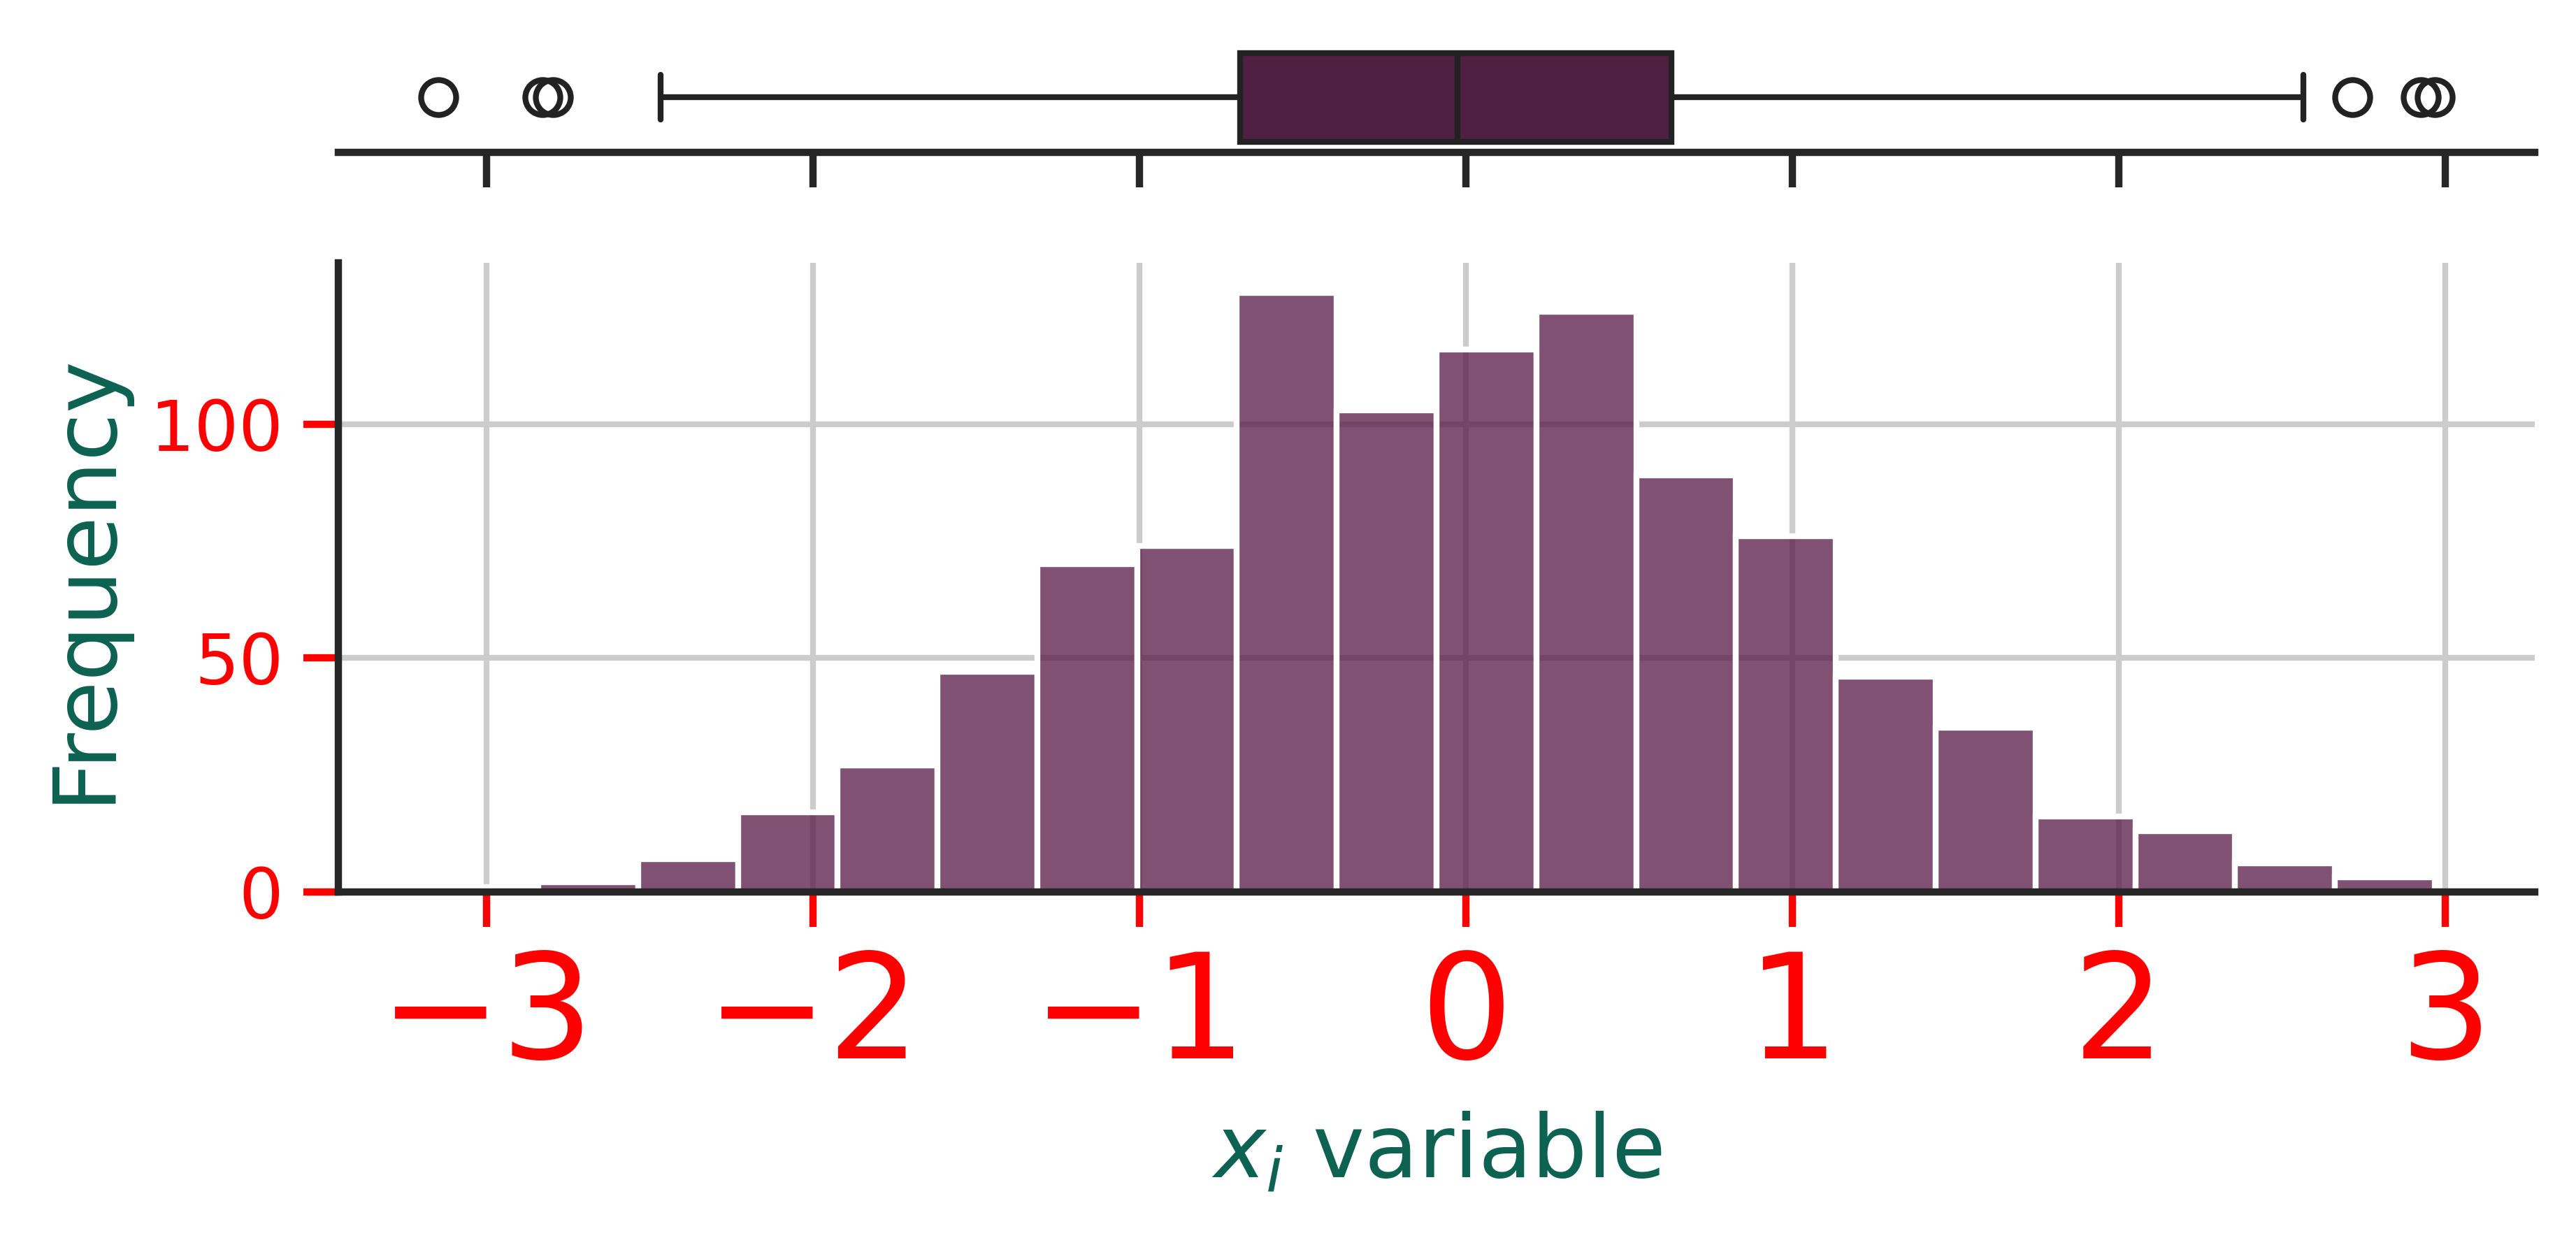
Figure 1. Histogram chart
Example 2
We will do the same example shown earlier but using the function inside a looping.
# pip install easyplot-toolbox
# or
# pip install --upgrade easyplot-toolbox
from easyplot_toolbox import *
# or
# from easyplot_toolbox import histogram_chart

# Data
data = [list(np.random.normal(0, 1, 1000)),
        list(np.random.normal(-5, 2, 1000)),
        list(np.random.normal(10, 1, 1000))]

# Plot in looping
names_and_colors = [['$x_{1}$', '#8C0C15'],
                    ['$x_{2}$', '#5FD34D'],
                    ['$x_{3}$', '#4DA7D3']]

for i in range(len(names_and_colors)):
    # Chart config
    chart_config = {
                    'name': f"figure_01-{i}_histogram_chart",
                    'extension': 'svg',
                    'width': 16,
                    'height': 8,
                    'dots_per_inch': 600,
                    'x_axis_label': names_and_colors[i][0],
                    'x_axis_size': 15,
                    'y_axis_label': 'Frequency',
                    'y_axis_size': 15,
                    'axises_color': '#000000',
                    'labels_size': 15,
                    'labels_color': '#000000',
                    'chart_color': names_and_colors[i][1],
                    'bins': 20,
                    }

    # Call function
    histogram_chart(dataset=data[i], plot_setup=chart_config)


Figure 2. Histogram chart