treemap_chart
This function creates a treemap chart.
treemap_chart(**kwargs)
Input variables
| Name | Description | Type |
|---|---|---|
plot_setup | Setup chart dictionary with the following keys:
| Dictionary |
dataset | Dataset to plot | List or array |
Output variables
| Name | Description | Type |
|---|---|---|
None | The function displays the plot on the screen and saves it to the local folder of the | None |
Example 1
Use the treemap_chart function to perform a task.
# Data
DF = pd.DataFrame({'values': [250, 120, 280, 320, 140, 95]})

# Chart setup
plot_setup = {
    'name': 'figure1-8-1',
    'width': 30,
    'height': 15,
    'colors': ['#91DCEA', '#64CDCC', '#5FBB68', '#F9D23C', '#F9A729', '#FD6F30'],
    'labels': ['Group 1', 'Group 2', 'Group 3', 'Group 4', 'Group 5', 'Group 6'],
    'label size': 20,
    'extension': 'svg',
    'dots per inch': 600
}


# Data statement
DATA = {'dataset': DF}

# Call function
treemap_chart(dataset = DATA, plot_setup = plot_setup)
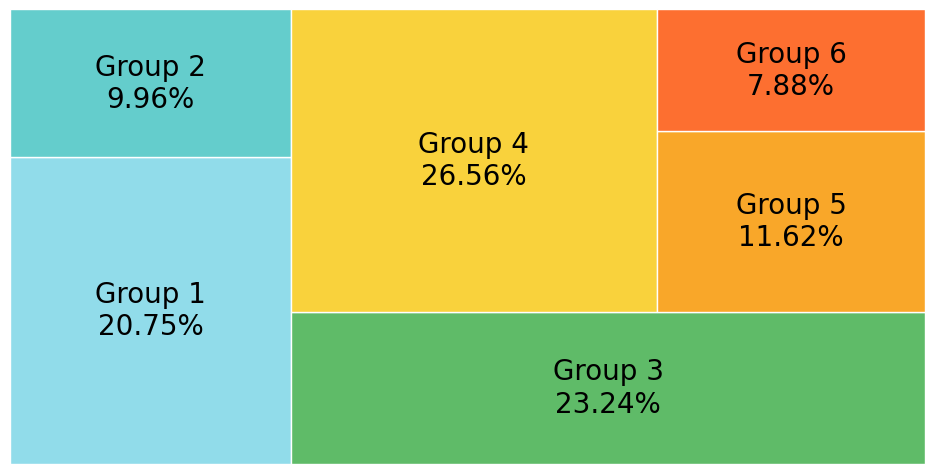
Figure 1. Example Treemap Chart.