smooth_line
This function creates a smooth line chart with optional log scales, grid, and customization options for line styles, colors, and labels.
smooth_line(**kwargs)
Input variables
| Name | Description | Type |
|---|---|---|
plot_setup | Setup chart dictionary with the following keys:
| Dictionary |
dataset | Dataset to plot | List or array |
Output variables
| Name | Description | Type |
|---|---|---|
None | The function displays the smooth line chart on the screen and saves it to the local folder of the .ipynb or .py | None |
Example 1
Use the smooth_line function to create a smooth line chart from the dataset.
from easyplot_toolbox.easyplot import smooth_line
import numpy as np

x = np.linspace(0, 10, 100)
curve1 = np.sin(x) + np.random.normal(0, 0.1, len(x))
curve2 = np.sin(x) + np.random.normal(0, 0.1, len(x))
curve3 = np.sin(x) + np.random.normal(0, 0.1, len(x))

df = {
    'x': x,
    'curve1': curve1,
    'curve2': curve2,
    'curve3': curve3
}

# Chart setup
chart_config = {
    'name': 'smooth_line_with_confidence_interval',
    'width': 20,
    'height': 15,
    'extension': 'jpg',
    'dots_per_inch': 100,
    'line_width': [2],
    'line_style': ['-'],
    'y_axis_label': 'Axis Y',
    'x_axis_label': 'Axis X',
    'labels_size': 12,
    'labels_color': 'black',
    'x_axis_size': 10,
    'y_axis_size': 10,
    'axises_color': 'gray',
    'x_limit': [0, 10],
    'y_limit': [None, None],
    'chart_color': ['blue'],
    'on_grid': True,
    'y_log': False,
    'x_log': False,
    'legend_location': 'best',
    'size_legend': 10,
}

# Call function
smooth_line(dataset=df, plot_setup=chart_config)
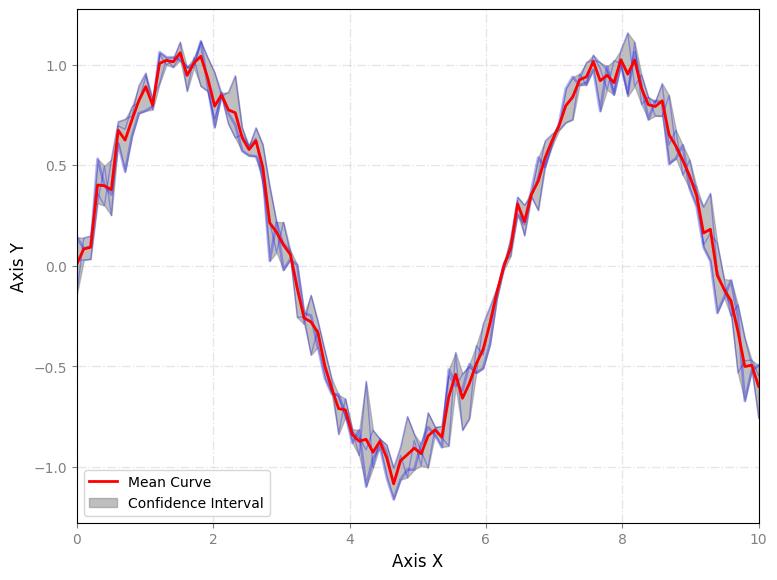
Figure 1. Joyplot of the dataset.