scatter_chart
This function shows a scatter chart.
scatter_chart(**kwargs)
Input variables
| Name | Description | Type |
|---|---|---|
plot_setup | Setup chart Dictionary with the following keys:
| Dictionary |
dataset | Dataset to plot | List or array |
Output variables
| Name | Description | Type |
|---|---|---|
None | The function displays the plot on the screen and saves it to the local folder of the .ipynb or .py | None |
Example 1
We use the scatter_chart function to plot a relationships among height, weight, and age.
# Data
df = {
        'x0': [1, 2, 3, 4, 5, 6],
        'y0': [1, 2, 3, 4, 5, 6],
        'x1': [7, 8, 9, 10, 11, 12],
        'y1': [7, 8, 9, 10, 11, 12],
        'x2': [13, 14, 15, 16, 17, 18],
        'y2': [13, 14, 15, 16, 17, 18],
        'x3': [19, 20, 21, 22, 23, 24],
        'y3': [19, 20, 21, 22, 23, 24],
     }

# Chart setup
chart_config = {
                'name': 'figure1-3-1',
                'width': 16.,
                'height': 8.0,
                'dots_per_inch': 600,
                'extension': 'svg',
                'marker_size': 50,
                'color_map': ['red', 'blue', 'green', 'yellow'],
                'x_axis_label': 'Weight',
                'x_axis_size': 14,
                'y_axis_label': 'Height',
                'y_axis_size': 14,
                'axises_color': 'red',
                'labels_size': 14,
                'labels_color': 'blue',
                'on_grid': False,
                'y_log': False,
                'x_log': False,
                'legend': ['data0', 'data1', 'data2', 'data3'],
                'legend_location': 'upper left',
                'size_legend': 12,
               }

# Call function
scatter_chart(dataset=df, plot_setup=chart_config)
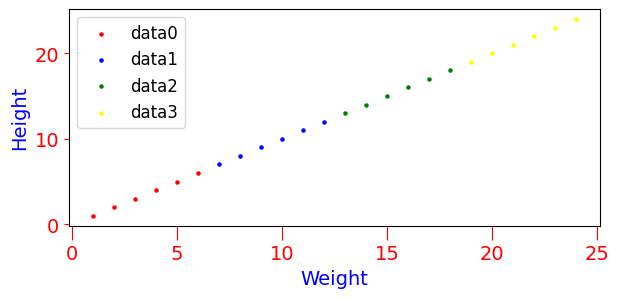
Figure 1. Scatter chart